Disclosure: this article contains an affiliate link. If you buy through it, we may earn a commission.
People often want to understand the process of how a published web link, article, or research study turns into a visual data graphic.
What Link to Infographics Actually Does
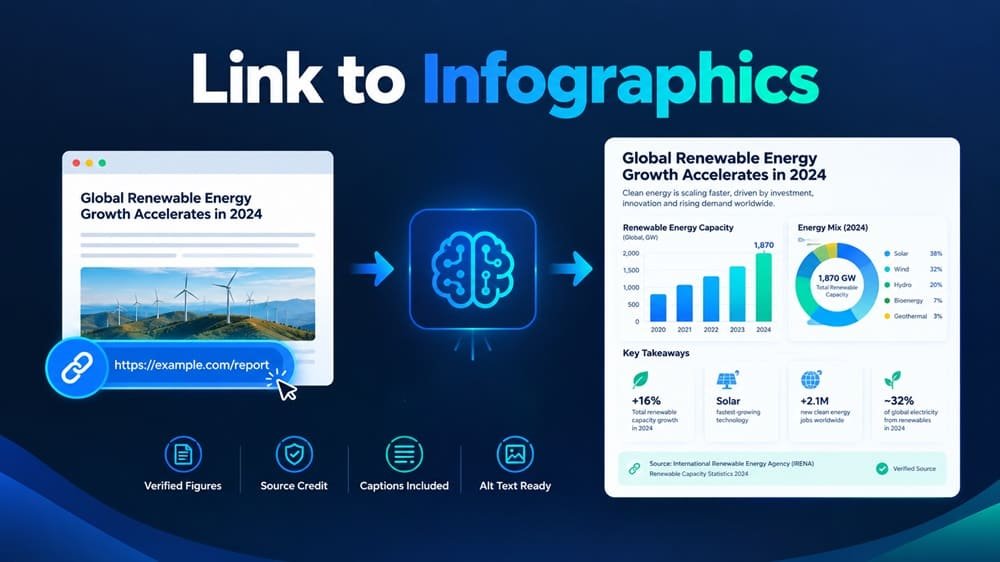
Link to Infographics is a digital prompt studio designed to convert articles, reports, studies, and website links into finished visual graphics. Instead of requiring you to open complex design software or hire a graphic designer, the software reads the content from a provided URL. It identifies the core statistics, structures those figures into a visual format, and delivers finished image files.
The software focuses on factual accuracy. Each graphic produced includes traceable figures that match the original content. This approach prevents the common visual errors that happen when numbers are transferred manually between documents and visual editing apps.
Key Features and How They Work in Real Publishing
The utility of any content tool comes down to how its specific features perform during everyday publishing tasks.
Link-to-Graphic Conversion Engine
The core engine converts written content into visual layouts. You input a URL from an online study, news report, or blog post. The system processes the text, identifies primary numeric data, and builds structured layouts around those points.
In everyday work, this removes the need to outline visual concepts on paper. Writers and site owners often know what an article says but lack the technical background to arrange visual elements cleanly. The engine decides how to balance headers, body numbers, and visual hierarchy so the final asset looks complete.
Three-Question Workflow
Visual projects often involve many configuration steps that slow down publication. Once you paste your link, you answer these three prompts to establish the direction of the graphic.
Source-Line Attribution on Finished Images
Plagiarism and inaccurate data are serious concerns when publishing online.
Readers and editorial teams can instantly verify where each number originated. This transparency builds credibility with your audience because visitors can see that the data points come from legitimate research rather than unverified claims.
Multi-Size File Generation
One visual shape doesn’t fit every channel.
You receive finished visual files pre-formatted for different layout dimensions. This means you don’t have to open photo-editing software just to crop, stretch, or re-align text blocks for different display spaces.
Production-Grade Finished Outputs
Many online utilities provide rough concept art, draft prompts, or wireframe templates that require secondary editing.
Full Private Label Rights (PLR) Included
The tool comes standard with full Private Label Rights. This licensing structure allows buyers to rebrand the entire system and market it as their own proprietary service or product.
Tip: Keep your reference links focused on data-dense articles so the conversion engine has plenty of verified numbers to build complete charts.
Solving Common Visual Content Bottlenecks
Creating graphics from scratch presents regular operational challenges for website managers, marketing agencies, and independent publishers. Understanding these friction points helps illustrate where the platform fits into a publishing routine.
Eliminating Manual Screenshot Hazards
A widespread habit among online writers is taking screenshots of charts found on other websites. While fast, this habit creates multiple problems:
- Low image resolution that looks blurry on mobile devices.
- Mismatched colors that clash with your site design.
- Potential copyright disputes from using proprietary graphics without permission.
- Broken user trust when watermarks from competing sites appear in your articles.
Using a dedicated studio ensures your site displays crisp, original graphics tailored to your exact publication layout, keeping your branding consistent and clear.
Reducing Designer Reliance and Production Delays
Hiring freelance graphic designers for every data point is expensive and slow. Communicating design revisions back and forth often delays an article release by days.
Using an automated studio lets an editor turn a reference link into an asset in minutes. This speed makes it possible to cover breaking news, fresh industry surveys, and seasonal trends while the subject matter is still top of mind for readers.
Protecting Data Integrity Across Teams
When editorial teams summarize third-party reports manually, transcription errors frequently happen. A writer might drop a decimal point, misread a percentage as a whole number, or mislabel an axis.
Because the system pulls numbers directly from the target link and pairs them with explicit source lines, the resulting graphic preserves the original context.
Can Infographics Realistically Improve Your Search Visibility?
Publishing visual graphics directly supports organic search optimization by improving user engagement and attracting natural external references. Search engines like Google evaluate user signals to determine whether a web page satisfies visitor intent. When readers encounter a clear, data-driven image, they tend to spend more time absorbing the content rather than bouncing back to the search results.
Furthermore, original data visuals serve as visual citations. According to the Federal Trade Commission guidelines on disclosures, clear attribution and truthful representations are essential whenever digital content presents factual claims or professional endorsements. Providing clear source lines on your graphics ensures transparency, which builds domain trust over time. Other websites writing about the same subject frequently link back to the page hosting the original graphic as their primary citation, generating valuable editorial backlinks without manual outreach campaigns.
Link to Infographics vs Traditional Creation Workflows
Choosing how to produce visual assets depends on your budget, production volume, and technical skill. The following table illustrates how this automated prompt studio compares to hiring professional designers or using standard template-based design platforms.
| Workflow Factor | Link to Infographics | Freelance Graphic Designer | Manual Template Platforms |
|---|---|---|---|
| Input Requirement | Web link plus 3 questions | Detailed creative brief and notes | Blank canvas or static template |
| Data Extraction | Automated from source URL | Manual reading by contractor | Manual typing and manual entry |
| Attribution Handling | Automated source-line print | Dependent on designer instruction | Manually added by user |
| Output Delivery | Finished image files | Layered design files or flat images | Manual file export per size |
| Commercial Freedom | Full Private Label Rights included | Work-for-hire or restricted license | Platform-specific licensing terms |
| Skill Requirement | Basic copy and paste | Project management and creative direction | Layout, typography, and color skills |
Common Problems and Fixes When Converting Links to Visuals

Even streamlined systems require clean inputs to deliver publication-quality results. Here is how to navigate common issues when converting text links to visual graphics.
Why does the generated graphic lack detailed numbers?
This occurs when the input URL doesn’t contain enough concrete numerical data. If you submit an opinion editorial or a general summary article that speaks in broad concepts rather than specific metrics, the system lacks raw figures to plot. To resolve this, choose source links that feature empirical studies, survey findings, census data, or structured financial reporting.
Why does the text layout appear crowded?
If a reference link contains complex academic formulas, long scientific descriptions, or excessive paragraphs, the visual layout may become cramped. You can fix this during the three-question setup phase by narrowing your project focus. Tell the system to highlight only the primary findings or the top three comparative points rather than attempting to display the entire research paper in a single image.
What should you do if a source link is behind a login wall?
The conversion engine requires accessible web content to read and parse information accurately. If you input a link from a private database, paid subscription publication, or password-protected intranet, the system can’t inspect the page contents. To fix this, copy the text into an accessible, publicly viewable URL, or use an unblocked public summary of that same dataset.
How to Integrate Generated Graphics into Your Content Schedule
To get the most utility out of an automated prompt studio, establish a consistent production routine. Following a structured series of steps ensures your visual assets support your broader digital publishing goals.
- Locate an authoritative source. Identify an industry study, government release, or data-rich article that contains clear statistics relevant to your audience niche.
- Review the core data points. Quickly inspect the reference page to ensure the figures are current, verifiable, and logically organized.
- Submit the link to the platform. Paste the public URL directly into the prompt studio input field.
- Answer the setup prompts. Complete the three operational questions to guide the tone, focus, and visual priorities of the project.
- Download the separate size variants. Save the generated image files to your local storage, ensuring you keep the distinct dimensions organized by intended platform.
- Verify the plotted figures. Double-check that the printed numbers match the original study and that the automated source line is legible.
- Embed the graphic into your post. Place the visual asset directly below the introductory section of your article to capture reader attention early.
- Add informative image alt text. Write a descriptive alt tag summarizing the graphic’s data points so search engine crawlers and screen readers can interpret the asset.
What Buyers Should Check Before Purchasing
Before deciding whether to adopt this prompt studio, evaluate your specific operational needs against the product capabilities.
First, consider your standard publishing content. If your business focuses entirely on lifestyle storytelling, personal memoirs, or abstract philosophy without numerical data, an automated data-graphic generator will offer limited value.
Third, confirm your client requirements if you intend to use the Private Label Rights. While full PLR terms allow you to rebrand the service and keep client earnings, you must decide how you’ll market this capability—whether as an automated agency service, a packaged visual content pack, or an add-on to ongoing digital marketing retainers.
Tip: If a client requests custom brand fonts or proprietary corporate icons, prepare to do minor post-export styling in your standard image editing software.
Professional Perspectives on Visual Asset Automation
Industry publishers and content strategists generally agree that visual assets drive higher engagement, but the manual cost of creating them remains a significant hurdle. In standard publishing environments, graphic production is often the slowest step in the editorial pipeline.
Publishers who manage high-traffic blogs or manage visual branding for multiple local businesses find that automated extraction tools significantly lower production overhead. The primary requirement for success remains the quality of the starting data: strong source links produce compelling graphics, while poorly researched links yield uninformative visuals.
Is Link to Infographics the Right Choice for Your Business?
The decision to buy this platform comes down to your content strategy, team capacity, and production goals.
If your team publishes research-backed blog posts, client reports, or digital marketing material, visual graphics are essential for retaining reader attention. Hiring dedicated illustrators for regular publishing quickly becomes cost-prohibitive. For small agencies, independent bloggers, and digital product sellers, an automated studio offers an efficient path to consistent, professional visual content.
However, if your projects require custom hand-drawn character illustrations, highly complex interactive web coding, or bespoke branding that deviates from standard chart structures, you’ll still need custom graphic design work. The system is built for rapid, reliable, source-attributed data visualization—not abstract creative design.
If you produce content based on facts, reports, and industry trends, using Link to Infographics to transform simple links into finished, traceable graphics provides a dependable way to scale your visual media production.
Frequently Asked Questions
Can you use the generated graphics for client work?
Yes, the system includes full Private Label Rights. This licensing structure allows you to take the finished infographic files, apply your own branding or agency identity, and deliver them directly to paying business clients without paying additional licensing fees or ongoing royalties.
Do you need graphic design experience to use this?
No graphic design background is required. The platform operates as a prompt studio where you paste an existing web link and answer three setup questions. The software automatically handles the visual structure, data alignment, typography layout, and output file formatting.
Are the source lines permanently displayed on the image?
Yes, every output graphic carries its traceable source line printed directly on the image file. This design ensures that every figure remains connected to its original reference document, helping publishers maintain transparency and journalistic credibility across different platforms.
Does the system work on any type of website link?
The software works with accessible public links containing written text and numerical data, such as articles, reports, studies, and surveys. It can’t process links located behind private subscriber paywalls, password-protected portals, or pages lacking concrete factual figures.
What file formats do you receive after conversion?
The system generates separate, finished image files sized for different publishing dimensions. Rather than providing rough concept wireframes, code snippets, or prompt ideas, the tool delivers completed visual assets ready to be uploaded directly into your content management system.
Review your current editorial workflow, determine whether your upcoming publications rely on verifiable data, and confirm whether automated visual generation fits your broader publishing strategy.
Conclusion
You don’t need to be a professional designer to start sharing your own data. Pick a simple topic you’re passionate about and try sketching a basic chart today. It’s a great way to make your ideas clearer, and you’ll find that your audience really appreciates the extra effort you’ve put in.